Shiba Inu (SHIB) has long captivated the cryptocurrency world with its meme coin origins and ambitious ecosystem developments. As of recent market observations in 2026, SHIB demonstrates dynamic stability hovering around the 0.00002429 USD level, signaling a bearish yet resilient trend amid broader market fluctuations. This price analysis delves into the technical indicators, fundamental factors, and potential trajectories shaping SHIB’s path forward, offering traders and investors a roadmap to navigate its volatile landscape.
Shiba Inu’s Current Market Dynamics
Shiba Inu, often dubbed the “Dogecoin killer,” has evolved far beyond its 2021 hype cycle. By 2026, the token maintains a notable presence in the top altcoin rankings, buoyed by its loyal community and expanding utility. The current price stabilization near 0.00002429 USD reflects a delicate balance between selling pressure and underlying support mechanisms. This level acts as a psychological floor, where accumulated buying interest prevents deeper declines, even as bearish sentiment dominates short-term charts.
Market volatility remains a hallmark of meme coins like SHIB, influenced by macroeconomic factors such as interest rate decisions, regulatory news, and Bitcoin’s performance. In recent sessions, SHIB has experienced intraday swings, dropping from highs around 0.00002566 USD before finding footing. This consolidation phase suggests traders are awaiting a catalyst—be it a Shibarium upgrade or broader crypto rally—to ignite momentum.
Trading volume has been moderate, indicating reduced frenzy compared to past bull runs, but sufficient to sustain liquidity. The 24-hour change hovers in negative territory, underscoring bearish control, yet the absence of panic selling points to growing maturity in SHIB’s market structure. Investors should monitor how this stability holds against external pressures, as meme coins often amplify overall market trends.
Key Metrics Signaling Stability
- Bollinger Bands: Upper band at approximately 0.00002581 USD serves as immediate resistance, while the lower band near 0.00002213 USD provides robust support.
- Moving Averages: Price trading below key EMAs reinforces bearish bias, but proximity to the 50-period MA hints at potential bounce opportunities.
- Relative Strength Index (RSI): Reading around 47 on shorter timeframes indicates neutral momentum, neither overbought nor deeply oversold.
These indicators collectively paint a picture of Shiba Inu price analysis favoring caution, with room for reversal if bullish volume surges.
4-Hour Chart Technical Breakdown
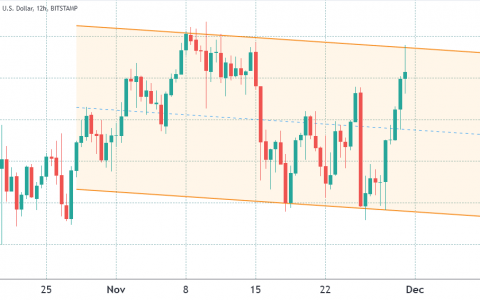
On the 4-hour timeframe, SHIB’s chart reveals a clear bearish structure, characterized by lower highs and lower lows. The price action has respected the descending channel since recent peaks, with the current consolidation at 0.00002429 USD testing the channel’s midline. This setup is classic for range-bound trading, where volatility contraction precedes expansion.
Bollinger Bands have tightened, signaling an impending breakout. A move above the upper band at 0.00002581 USD could target 0.00002700 USD, invalidating the bearish thesis. Conversely, a breach below 0.00002213 USD opens the door to 0.00002000 USD, a level rich in historical support. Traders often use this timeframe for swing trades, capitalizing on quick reversals driven by whale activity or news events.
The RSI at 47 underscores indecision; it’s dipping into lower neutral territory but showing divergence from price lows, a subtle bullish signal. Coupled with MACD lines converging near the zero line, momentum could shift if histogram bars turn positive. Volume profile analysis highlights accumulation zones around current levels, suggesting smart money positioning for upside.
Common Patterns and Their Implications
Watch for these recurring formations in SHIB’s 4-hour charts:
- Descending Triangle: Bearish continuation if support fails; bullish reversal on neckline break.
- Double Bottom: Potential at lower Bollinger Band, signaling exhaustion of sellers.
- Flag Pattern: Post-rally consolidations that resolve upward in bull markets.
Understanding these patterns enhances SHIB technical analysis, allowing for precise entry and exit points.
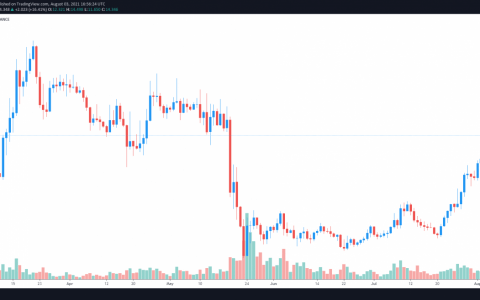
Daily Chart Insights: Broader Trend Perspective
Zooming out to the daily chart provides a more comprehensive view of SHIB’s trajectory. Here, the bearish trend is more pronounced, with price below the 200-day moving average—a key long-term bear signal. Resistance looms at 0.00003348 USD, the upper Bollinger Band, representing a multi-week hurdle rooted in prior swing highs.
Support at 0.00002205 USD aligns with the lower band and Fibonacci retracement levels from the 2025 rally, offering a safety net. RSI on daily sits at 42, in the lower neutral zone, reflecting balanced buy-sell activity without extreme fear. This stability contrasts with 2022’s wild swings, attributable to matured infrastructure like Shibarium layer-2 scaling.
Ichimoku Cloud analysis shows price below the cloud, confirming downtrend, but a flattening Senkou Span suggests weakening bearish momentum. On-balance volume (OBV) trends sideways, indicating no aggressive distribution—a positive for bulls eyeing reversal.
Historical Context and Cycle Comparisons
Comparing to past cycles, SHIB’s current phase mirrors pre-breakout consolidations. In 2021, similar RSI levels preceded a 10x surge. By 2026, with enhanced tokenomics including burns exceeding billions weekly, the setup holds greater legitimacy. Yet, meme coin risks persist: hype-driven pumps can reverse sharply without fundamentals.
Fundamental Factors Driving SHIB’s Price Stability
Beyond technicals, SHIB’s price stability stems from ecosystem advancements. Shibarium, the Ethereum layer-2 solution, has processed millions of transactions by 2026, slashing fees and boosting DeFi adoption via SHIB-based liquidity pools. Bone (BONE) as gas token enhances utility, drawing developers to build dApps.
Token burn mechanisms remain pivotal: Community-led initiatives, partnered exchanges, and transaction taxes have deflationated supply, countering inflationary pressures. ShibMetaverse and NFT projects add narrative fuel, while integrations with wallets like MetaMask expand accessibility.
Market sentiment, gauged via social volume on platforms like Twitter and LunarCrush, shows steady engagement. Whale wallets holding steady amid dips signal confidence. Regulatory clarity in the US and UK—post-SEC vs. Ripple outcomes—bolsters institutional interest, indirectly supporting SHIB.
Risks from Broader Crypto Ecosystem
- Bitcoin Dominance: Rising BTC dom often crushes altcoins like SHIB.
- Regulatory Scrutiny: Meme coins vulnerable to “securities” labels.
- Competition: Newer memes like PEPE challenge SHIB’s hype throne.
These factors underscore why Shiba Inu price prediction models emphasize diversified exposure.
Practical Trading Strategies for SHIB
For traders eyeing SHIB’s stability, employ risk-managed approaches. Scalping the 4-hour range between 0.00002213 USD and 0.00002581 USD suits short-term plays, using RSI crossovers for entries. Swing traders target daily resistance breaks, setting stops below support.
Dollar-cost averaging (DCA) appeals to long-term holders, mitigating volatility. Leverage derivatives cautiously—futures on Binance offer 4-hour signals but amplify losses. Portfolio allocation: Cap SHIB at 5-10% for balanced risk.
Tools like TradingView for custom alerts and CoinMarketCap for ecosystem updates enhance decision-making. Always pair technicals with fundamentals: A Shibarium milestone could catalyze upside.
Advanced Techniques
- Fibonacci Extensions: Project targets post-breakout (e.g., 1.618 level at 0.000040 USD).
- Volume-Weighted Average Price (VWAP): Intraday mean reversion trades.
- Sentiment Analysis: Track Fear & Greed Index for contrarian signals.
Conclusion
Shiba Inu’s price analysis reveals a market entrenched in bearish stability around 0.00002429 USD, with technicals favoring caution but fundamentals hinting at reversal potential. While shorts dominate, exhaustion signs and ecosystem growth position SHIB for upside surprises. Key takeaways: Monitor Bollinger Band squeezes for breakouts, diversify to manage meme coin risks, and stay informed on Shibarium developments. Conduct thorough due diligence, as volatility defines this space—patience rewards the prepared investor.
Frequently Asked Questions
What is the current outlook for Shiba Inu price?
The short-term outlook remains bearish with stability around key supports, but daily charts show potential for bullish reversal if resistance breaks, driven by technical divergences and fundamentals.
How do Bollinger Bands influence SHIB trading decisions?
Bollinger Bands highlight volatility and key levels: trading near the lower band signals buying opportunities, while upper band tests offer sell targets, aiding range-bound strategies.
What role does Shibarium play in SHIB’s price stability?
Shibarium’s layer-2 efficiency reduces fees, boosts utility, and attracts users, providing a fundamental backbone that supports price floors during market downturns.
Is SHIB a good long-term investment?
SHIB offers high-reward potential via burns and ecosystem growth, but as a meme coin, it’s high-risk; suitable for small allocations in diversified portfolios.
How can I predict SHIB price movements?
Combine technical analysis (RSI, MAs), on-chain metrics (burns, volume), and sentiment tools for informed predictions, always with stop-losses.
内容搜集自网络,整理者:dfkai,如若侵权请联系站长,会尽快删除。