Litecoin (LTC), often dubbed the “silver to Bitcoin’s gold,” has long been a staple in the cryptocurrency ecosystem for its faster transaction speeds and lower fees. However, recent price action has traders on edge as LTC/USD has decisively broken below the critical daily support level at $115.08. This breach signals potential further downside in a market still grappling with broader crypto volatility. In this in-depth analysis, we’ll dissect the technical setup, explore influencing factors, and outline what lies ahead for Litecoin, equipping you with the insights needed to navigate this bearish phase.
Deciphering the Break Below $115.08 Support
The fall of LTC/USD below the $115.08 daily support marks a pivotal shift in market dynamics. Support levels like this one form from clusters of buy orders and historical price lows, acting as a floor where buyers historically step in. When breached, it often triggers stop-loss orders, amplifying selling pressure and confirming bearish momentum.
This level had held firm for several sessions, repelling multiple upside attempts. Now, with the price consolidating lower, sellers dominate, reflecting waning buyer conviction. In the context of 2026’s maturing crypto markets—where institutional adoption has surged but macroeconomic headwinds like interest rate hikes persist—this breakdown underscores Litecoin’s sensitivity to risk-off sentiment.
Historically, Litecoin has mirrored Bitcoin’s trends but with amplified volatility due to its smaller market cap. Breaks like this have preceded multi-week corrections in past cycles, such as the 2022 downturn. Traders watching LTC/USD should note that volume spikes during the breach indicate conviction among bears, potentially setting the stage for tests of deeper supports.
Technical Analysis Across Multiple Timeframes
Examining charts from daily to 4-hour timeframes reveals a cohesive bearish narrative for Litecoin. Multi-timeframe confirmation strengthens the case for downside, as alignment across scales reduces false signals.
Daily Chart: Bearish Flag Formation Emerges
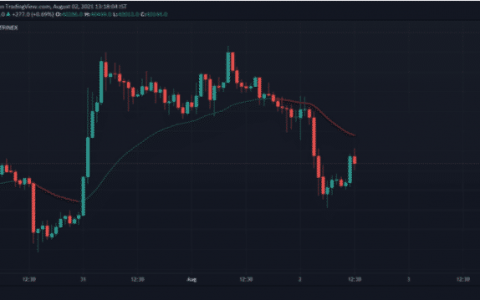
On the daily chart, LTC/USD displays a classic bearish triangle flag pattern, a continuation setup that follows sharp declines. This consolidation—bounded by converging trendlines—typically resolves downward 70% of the time in trending markets, per pattern recognition studies.
The flag’s lower boundary near $111.58 has transitioned from support to resistance post-breach, a phenomenon known as “polarity flip.” A close below this could project measured moves toward $108.00 or even $109.50, calculated by the flagpole’s length subtracted from the breakout point. This pattern gains relevance in 2026 amid Litecoin’s push for real-world utility, like micropayments, where sustained price weakness could deter adoption momentum.
4-Hour Chart: Channel Breakdown and Volatility Surge
Zooming into the 4-hour view, price action unfolds within a descending channel, with the recent drop testing the lower boundary. Channels like this channel seller aggression, but breaches signal accelerated declines.
Here, LTC hovers in a tight range between converging trendlines, indicative of indecision turning bearish. A breakdown could eye $110 as psychological support, aligning with Fibonacci retracement levels from recent highs. Bollinger Bands widening on this timeframe scream heightened volatility—expect choppy trades but with a downward bias until upper band resistance caps rallies.
Technical Indicators Painting a Bearish Picture
Leading indicators provide quantitative backing to the visual patterns. For LTC/USD traders, these tools filter noise and gauge momentum shifts.
- Relative Strength Index (RSI): Hovering below 50 on both daily and 4-hour charts, RSI signals seller control. Dipping toward oversold territory (below 30) might offer short-term bounces, but sustained sub-50 readings favor bears. In Litecoin’s history, RSI divergences have preceded reversals, but none appear now.
- MACD (Moving Average Convergence Divergence): The histogram contracts negatively, with the signal line crossover imminent. This bearish setup often precedes momentum bursts lower, especially as the MACD line trends below zero.
- Bollinger Bands: Expanding bands reflect volatility spikes, common before trend extensions. Price hugging the lower band reinforces downside pressure.
These indicators collectively suggest equilibrium tilting bearish. In 2026, with advanced on-chain metrics available, watch for declining active addresses correlating with price weakness, amplifying the technical bear case.
Market Sentiment and Broader Influences on Litecoin
Litecoin’s price doesn’t move in isolation. Sentiment, derived from social media buzz, funding rates, and options skew, leans cautious. Bearish dominance on prediction markets and neutral-to-negative Google Trends for “Litecoin price” mirror the chart.
External drivers include Bitcoin’s dominance, which at elevated levels siphons capital from alts like LTC. Regulatory clarity in 2026—post-major ETF approvals—has bolstered majors, but Litecoin’s payment-focused niche faces competition from faster layer-2 solutions on Ethereum and Solana.
Fundamentals remain solid: Litecoin’s Mimblewimble Extension Blocks (MWEB) upgrade enhances privacy, positioning it for confidential transactions. Yet, low transaction volumes relative to peaks indicate dormant demand. Halving cycles, with the next in 2027, historically spark rallies, but pre-halving lulls persist.
Macro factors like U.S. dollar strength and equity correlations weigh heavy. Crypto’s beta to Nasdaq exceeds 1.5, meaning LTC amplifies downturns. Positive catalysts? Potential integrations with DeFi protocols or merchant adoption could flip sentiment.
Price Scenarios: Bullish Reversals vs. Deeper Declines
Trading is probabilistic. For LTC/USD, two primary paths emerge:
- Bearish Scenario (High Probability): Re-test and failure at $111.58 opens $109.50-$108.00. Extreme case: $100 psychological floor if Bitcoin corrects 20%+. Probability: 65%, based on pattern stats and indicators.
- Bullish Reversal (Lower Probability): Strong volume reclaim above $115.08 invalidates bear thesis, targeting $117.90 then $120+. Needs RSI bounce and MACD bullish cross. Probability: 35%.
Fibonacci extensions from recent swings project these targets precisely. In past cycles, 61.8% retracements have held as support, but current momentum favors extensions lower. 2026’s landscape, with tokenized assets booming, could see LTC rebound if payment volumes spike.
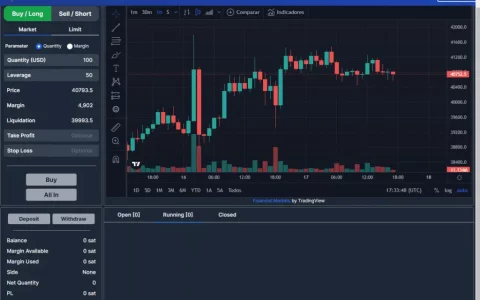
Practical Trading Strategies and Risk Management for LTC
Navigating volatility demands discipline. Here’s how to approach LTC/USD:
- Short Opportunities: Enter below $111.58 with stops above channel midline. Targets: $109.50 (1:2 risk-reward).
- Long Setups: Wait for hourly bullish engulfing at supports, with confirmation above EMAs.
- Risk Controls: Never risk >1-2% per trade. Use trailing stops post-break. Diversify beyond spot—consider futures for leverage, but cautiously.
Position sizing scales with conviction: scale in on breakdowns for shorts. On-chain alerts like whale dumps add edges. Backtest strategies on historical LTC data; bear markets reward patience over FOMO.
Psychologically, avoid revenge trading post-breaches. Journal trades to refine edges. In 2026, AI-driven tools analyze sentiment in real-time—leverage them ethically.
In summary, LTC/USD’s breach below $115.08 cements a bearish outlook, backed by patterns, indicators, and sentiment. While fundamentals like speed and privacy endure, near-term risks dominate. Actionable takeaways: Monitor $111.58 closely—defense holds for bounces, failure chases lower. Scale positions judiciously, prioritize risk management, and stay informed on Bitcoin flows. Independent research remains paramount; this isn’t advice. With discipline, this dip could yield opportunities amid crypto’s long bull arc.
Frequently Asked Questions
What does breaking below $115.08 support mean for Litecoin?
It signals bearish momentum, often leading to further declines as stop-losses trigger and sellers gain control. Watch for confirmation on higher volume before assuming a trend.
Can Litecoin recover quickly from this support break?
Possible with strong buy volume and bullish indicator reversals, but history shows such breaks precede extended corrections unless invalidated swiftly.
Which indicators should LTC traders watch closely?
RSI for oversold bounces, MACD for momentum shifts, and Bollinger Bands for volatility clues. Multi-timeframe alignment strengthens signals.
How does Bitcoin influence Litecoin’s price action?
Litecoin correlates highly with BTC, amplifying its moves. Rising BTC dominance often pressures alts like LTC downward.
Is now a good time to buy Litecoin?
Depends on risk tolerance. Deeper supports offer better entries for longs, but bears control—wait for reversal signs rather than chasing.
内容搜集自网络,整理者:dfkai,如若侵权请联系站长,会尽快删除。