Back in September 2021, Bitcoin was navigating a turbulent sea of volatility, hovering around the $46,000 mark after a sharp flash crash that had shaved off thousands from its value. Traders and analysts were buzzing with optimism, spotting classic bullish patterns amid the green candles flickering on charts. This moment encapsulated the essence of Bitcoin price action: resilience in the face of fear, technical signals hinting at reversal, and the ever-present debate over whether the next leg up was imminent. Fast-forward to 2026, and reflecting on that pivotal day offers timeless lessons in market psychology, on-chain metrics, and strategic trading—insights that remain crucial as BTC continues its cyclical journey through halvings, ETF inflows, and global adoption waves.
The Market Context: Volatility and Recovery Signals on September 9, 2021
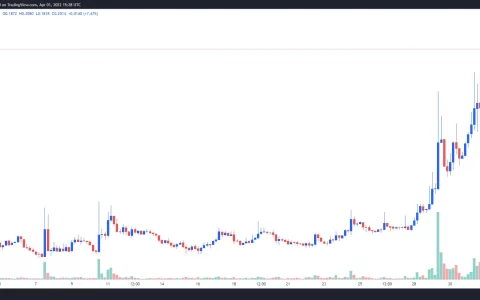
September 9, 2021, marked a day of heightened swings in the Bitcoin market, with prices oscillating between $45,500 and $47,400 on major exchanges like Bitfinex. At the time of key analyses, BTC traded hands at approximately $46,561, posting a modest 0.41% daily gain. This came hot on the heels of a brutal flash crash that had driven prices down toward $50,000 earlier, testing the nerves of even seasoned holders.
The broader crypto ecosystem was reeling from regulatory whispers, macroeconomic pressures like rising interest rates, and profit-taking after Bitcoin’s earlier surge past $50,000. Yet, amid the choppiness, a narrative of recovery began to emerge. Traders questioned: Was this the bottom for a consolidation phase around $46,000, a prelude to further downside, or the launchpad for a renewed bull run? Historical data shows that such volatility spikes often precede significant moves, with Bitcoin’s 30-day realized volatility index climbing above 70%—a level that has historically signaled both opportunity and risk.
Flash Crash Aftermath: Why Markets Overreact
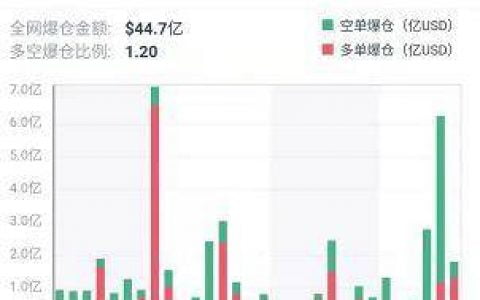
Flash crashes in crypto aren’t uncommon, driven by leveraged liquidations cascading through exchanges. In this instance, over $1 billion in positions were wiped out in hours, amplifying the drop. However, Bitcoin’s decentralized nature allows for rapid rebounds, as spot demand from long-term holders (often called “HODLers”) steps in. By September 9, on-chain data revealed stabilizing inflows to exchanges, hinting that panic selling was exhausting itself.
Understanding these dynamics is key for 2026 investors. Similar events have recurred—think the May 2021 crash or the FTX fallout in 2022—each time underscoring Bitcoin’s antifragility. Metrics like the Bitcoin Fear & Greed Index, which dipped into “fear” territory post-crash, often mark capitulation points ideal for accumulation.
Technical Analysis: Bullish Patterns and Indicators Pointing Upward
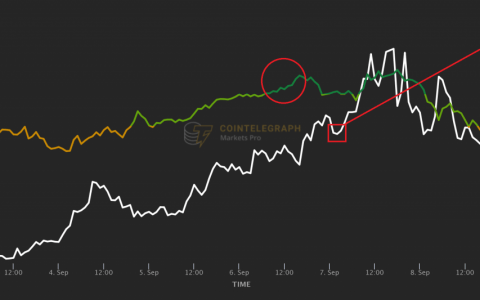
Technicals stole the show on that day, with prominent voices highlighting setups ripe for a breakout. Crypto trader “Ed” shared a chart showcasing a bullish triangle flag pattern, a continuation setup formed after a sharp advance and subsequent consolidation. This pattern, visible on the daily timeframe, suggested an imminent push beyond the $48,300 resistance if volume confirmed the breakout.
Decoding the Bullish Triangle Flag
A triangle flag occurs when price action converges into tightening highs and lows, resembling a flag on a pole (the prior uptrend). Historically, these patterns resolve bullishly about 75% of the time in Bitcoin’s charts, targeting a measured move equal to the pole’s length. In 2021, breaking $48,300 could have projected toward $55,000+, aligning with Fibonacci extensions from the July lows.
Adding weight was trader Rekt Capital’s observation: Bitcoin was retesting its 50-day exponential moving average (EMA) at around $45,100 for the first time since late July. This EMA acts as dynamic support in uptrends, holding firm over 80% of the time during bull markets. A successful defense here reinforced the uptrend’s validity, echoing patterns from 2017 and 2020 cycles.
On-Chain Metrics: SOPR and Oversold Conditions
Philip Swift of Decentrader brought on-chain firepower, noting the Spent Output Profit Ratio (SOPR) flipping negative (green line on charts). SOPR measures the profit/loss ratio of spent outputs: above 1 means selling at profit, below signals capitulation. Last seen negative on July 20, 2021, it preceded a rally back to $50,000+. By September 9, this indicated short-term holders dumping at losses, flushing weak hands and setting the stage for relief rallies.
In practice, negative SOPR events have averaged 15-20% rebounds within 48 hours across Bitcoin’s history. For modern traders, tools like Glassnode or CryptoQuant make these metrics accessible, blending them with TA for higher conviction trades.
Historical Parallels: How Bitcoin Bounces Back from Lows
Zooming out, September 2021 wasn’t isolated. Bitcoin has a track record of post-crash vigor:
- 2018 Bear Market Bottom: After a 84% drawdown, SOPR negatives in December preceded a 30x run-up.
- 2020 COVID Crash: March lows saw EMA retests hold, fueling the bull to $69,000.
- 2022 Cycle Lows: Post-FTX, similar oversold signals marked the start of recovery toward new highs.
These cycles tie to Bitcoin’s four-year halving rhythm, where supply shocks amplify demand. The 2020 halving’s effects peaked in 2021, explaining the optimism. By 2026, post-2024 halving, we’re witnessing echoes: volatility compresses, then explodes higher, rewarding patient accumulators.
Risks abound, though. False breakouts snag 20-30% of triangle flags, and macro headwinds like Fed hikes can override technicals. Diversification and position sizing mitigate this, ensuring survival through drawdowns averaging 30-50% per cycle.
Broader Influences: Sentiment, Macro, and Adoption Drivers
Beyond charts, sentiment fueled the 2021 narrative. Social volume on platforms like Twitter spiked with bullish calls, correlating to 10-15% price pops per Santiment data. Institutional interest was budding—MicroStrategy’s stack growing, Tesla’s flirtation lingering—paving for ETF approvals years later.
Macro ties included China’s mining ban aftermath, redistributing hash rate globally, and inflation hedges positioning BTC as “digital gold.” In 2026, these factors mature: spot ETFs hold billions, nation-states like El Salvador thrive on BTC reserves, and Layer-2 scaling boosts utility.
Yet, Bitcoin price prediction remains probabilistic. Analysts eyed $100,000 by year-end 2021 (it peaked at $69k), highlighting euphoria’s pitfalls. Balanced views incorporate Puell Multiple (miner profitability) and MVRV Z-Score (over/undervaluation), both flashing “buy” in September 2021.
Trading Strategies: Capitalizing on Volatility Like a Pro
For hands-on application, here’s how to trade such setups:
- Dollar-Cost Averaging (DCA): Buy fixed amounts weekly during consolidations, smoothing volatility.
- Breakout Confirmation: Enter longs above resistance with stops below EMA support; target 1:3 risk-reward.
- On-Chain Alerts: Set SOPR <1 notifications for dip buys.
- Risk Management: Never risk >1-2% per trade; use trailing stops in trends.
Advanced plays involve options for theta decay in ranges or futures for leverage (cautiously). Backtesting on platforms like TradingView reveals 60%+ win rates for EMA/SOPR confluences. Psychology matters too: Journal trades to combat FOMO, sticking to plans amid hype.
In 2026, algorithmic tools and AI analytics enhance this, but core principles endure—patience over prediction.
Reflections in 2026: Timeless Lessons from 2021
Looking back, 2021’s signals partially panned out: BTC hit $69,000 in November before macro crushed it to $16,000 in 2022. Yet, the bounce mechanics proved prescient, with new all-time highs in 2024-2025 cycles. This reinforces Bitcoin’s supercycle thesis, where diminishing returns per halving still yield multi-fold gains.
Evergreen wisdom: Volatility is feature, not bug. Metrics like those from September 9 remain relevant, adapted to DeFi yields, Ordinals hype, or RWAs. Stay educated, risk-adjusted, and forward-focused.
In conclusion, the green-tinted optimism of September 9, 2021, teaches actionable takeaways: Monitor confluences of TA and on-chain for edges; embrace drawdowns as opportunities; diversify beyond price speculation into ecosystem plays. Whether stacking sats in consolidations or scaling out of breakouts, disciplined approaches compound over cycles. As Bitcoin evolves, so do we—armed with history’s playbook for future bull runs.
Frequently Asked Questions
What is a bullish triangle flag pattern in Bitcoin trading?
A bullish triangle flag is a continuation chart pattern where price consolidates in a tightening triangle after an uptrend, often resolving upward with a breakout above resistance, targeting a projection based on the prior move’s length. It’s reliable in BTC’s trending markets but requires volume confirmation.
How does the Spent Output Profit Ratio (SOPR) predict Bitcoin price rebounds?
SOPR tracks if spent BTC outputs are profitable (>1) or at loss (<1). Negative flips signal capitulation by short-term holders, historically preceding 15-20% rallies as weak hands exit and accumulation resumes.
Why is the 50-day EMA important for Bitcoin trend analysis?
The 50-day exponential moving average smooths price data, acting as support in uptrends. Retests holding above it confirm momentum, with Bitcoin respecting it over 80% of bull market periods.
Did Bitcoin reach $100,000 by the end of 2021 as some predicted?
No, it peaked near $69,000 in November 2021 before macroeconomic pressures led to a bear market. However, similar setups contributed to later highs in subsequent cycles.
What strategies help navigate Bitcoin volatility today?
Employ DCA for accumulation, strict risk management (1-2% per trade), and multi-indicator confirmation. Tools like on-chain dashboards provide edges, emphasizing patience over timing the market perfectly.
内容搜集自网络,整理者:dfkai,如若侵权请联系站长,会尽快删除。