Disclaimer: This article is for informational and educational purposes only. Nothing herein constitutes financial, investment, or trading advice. Cryptocurrency markets are highly volatile, and you should consult a qualified financial advisor before making any investment decisions. Past performance is not indicative of future results.
Bitcoin entered 2026 riding the afterglow of a historic 2025 rally that carried BTC above $90,000 for the first time. Then reality set in. A brutal correction wiped nearly a third of Bitcoin’s value in a matter of weeks, sending prices plummeting to the low $60,000s before a tentative recovery brought BTC back into the mid-$70,000 range. For investors and traders trying to navigate what comes next, the question is urgent: can Bitcoin reclaim $90K—or is more pain ahead?
In this in-depth bitcoin price prediction 2026 analysis, we examine the current price action, critical technical levels, on-chain fundamentals, institutional capital flows, and the broader macroeconomic backdrop. We then lay out realistic bull and bear scenarios with concrete price targets for the remainder of the year.
Current Price Action: Where Does BTC Stand Right Now?
As of late March 2026, Bitcoin is trading in the $74,000–$76,000 range after a volatile first quarter. The timeline of events tells an important story:
- January 2026: BTC began the year near $88,000, buoyed by strong institutional inflows from late 2025 and optimism around the post-halving supply squeeze.
- February 2026: A cascade of liquidations—triggered by rising U.S. Treasury yields and hawkish Federal Reserve commentary—pushed Bitcoin below $70,000 for the first time in months. Panic selling accelerated as leveraged long positions were wiped out across major derivatives exchanges.
- Early March 2026: BTC hit its 2026 low near $60,500, a level that coincided with the realized price for short-term holders and the 200-week moving average on the weekly chart.
- Mid-to-Late March 2026: A relief rally, partly fueled by bargain-hunting from institutional desks and a modest softening in bond yields, has lifted BTC back to the $75,000 area.
The current bounce is encouraging, but it has not yet confirmed a trend reversal. Volume on the recovery remains below the volume seen during the sell-off, and Bitcoin is still trading below its 50-day and 100-day moving averages—both of which have turned into overhead resistance.
Technical Analysis: Key Levels to Watch
Technical analysis provides a framework for understanding where price may find support and resistance. Here are the critical levels for any BTC forecast in 2026:
Support Levels
- $72,000–$73,000: The immediate support zone. This area acted as consolidation support in Q4 2025 and has been retested successfully on the current pullback. A daily close below $72K would signal weakness.
- $65,000: A psychologically important level that aligns with the 0.5 Fibonacci retracement of the 2025 rally (measured from the April 2025 low of ~$42K to the December 2025 high of ~$91K). This zone also corresponds to significant on-chain accumulation.
- $60,000–$61,000: The 2026 low and the line in the sand for bulls. This level sits near the 200-week moving average and the realized price for short-term holders. A break below $60K would likely trigger another wave of capitulation.
Resistance Levels
- $78,000–$80,000: The 50-day moving average and a high-volume node on the volume profile. BTC needs to reclaim this zone with conviction to shift short-term momentum back to bullish.
- $85,000: The 100-day moving average and the breakdown point from January. A move above $85K would represent a higher high on the daily chart and significantly improve the technical outlook.
- $90,000–$92,000: The all-time high region. This is the ultimate target for bulls in 2026. Reaching this level would require sustained buying pressure and favorable macro conditions.
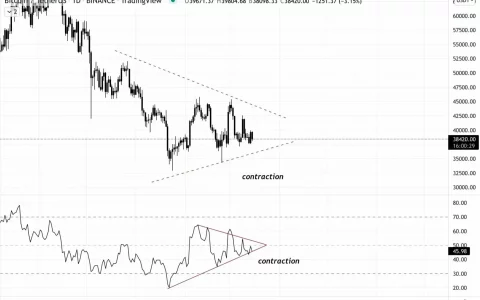
The Relative Strength Index (RSI) on the daily chart currently sits near 45, having bounced from oversold territory in early March. The weekly MACD remains in bearish territory but is beginning to flatten—a potential precursor to a bullish crossover if buying momentum continues. The Bollinger Bands have widened significantly during the crash and are now beginning to contract, suggesting a period of consolidation is likely before the next major directional move.
On-Chain Metrics: What the Blockchain Tells Us
On-chain analysis offers a view into the behavior of actual Bitcoin holders—data that is unique to crypto markets and unavailable in traditional finance. Several key metrics paint a nuanced picture for the bitcoin crash recovery thesis:
MVRV Ratio
The Market Value to Realized Value (MVRV) ratio dropped to approximately 1.3 during the March low—well below the overheated zone above 3.0 that typically signals cycle tops. Historically, MVRV readings between 1.0 and 1.5 have represented strong buying opportunities. The current reading suggests BTC is not overvalued relative to its cost basis, which is a constructive signal for medium-term price appreciation.
Exchange Reserves
Bitcoin held on exchanges has continued to decline throughout 2026, falling to levels not seen since 2018. This ongoing outflow indicates that holders are moving BTC to cold storage and self-custody solutions rather than positioning to sell. Reduced exchange supply, combined with the post-halving production cut, tightens the supply side of the equation.
Long-Term Holder Behavior
Long-term holders (wallets that have held BTC for more than 155 days) barely participated in the sell-off. The Long-Term Holder Supply metric actually increased during February and March, indicating that experienced investors viewed the crash as a buying opportunity rather than a reason to exit. This pattern mirrors the behavior seen during previous mid-cycle corrections in 2017 and 2021.
Realized Cap and STH-SOPR
The Short-Term Holder Spent Output Profit Ratio (STH-SOPR) dropped below 1.0 during the crash, meaning short-term holders were selling at a loss. This metric has since bounced back to approximately 1.0—the breakeven line. If STH-SOPR can sustain above 1.0, it would signal that the market has found a local bottom and short-term holders are no longer underwater.
Institutional Flows and ETF Dynamics
Institutional participation remains one of the most important variables in any BTC price analysis for 2026. The spot Bitcoin ETFs approved in the United States in January 2024 have fundamentally changed the demand landscape.
During the February crash, spot Bitcoin ETFs experienced their largest weekly outflow since launch—approximately $2.1 billion in net redemptions over a two-week period. However, context matters: total ETF AUM had grown to over $85 billion by that point, making the outflow roughly 2.5% of assets. This is a normal rebalancing event, not a structural exodus.
By mid-March, ETF flows turned positive again. BlackRock’s iShares Bitcoin Trust (IBIT) recorded its highest single-day inflow in three months on March 14, suggesting that institutional investors were using the dip to add exposure. Fidelity’s FBTC and Ark/21Shares’ ARKB also reported net inflows for the third week of March.
Beyond ETFs, corporate treasury holdings of Bitcoin continue to grow. MicroStrategy (now Strategy) has continued its accumulation strategy, and several mid-cap companies have announced Bitcoin treasury positions in Q1 2026. The trend toward Bitcoin as a corporate reserve asset remains intact despite the price correction.
Macro Factors: The Elephant in the Room
If there is one factor that dominates the bitcoin price prediction 2026 landscape, it is the macroeconomic environment—particularly U.S. monetary policy and bond market dynamics.
Federal Reserve Policy
The Federal Reserve’s stance has been the primary catalyst for Bitcoin’s volatility in early 2026. After cutting rates three times in 2025, the Fed paused in January 2026 amid persistent core inflation readings above 3%. The hawkish hold surprised markets that had priced in further easing, triggering a broad risk-off move that hit crypto especially hard.
As of March 2026, Fed funds futures imply roughly a 40% probability of a rate cut by June and a 65% probability by September. Any dovish pivot—whether through explicit rate cuts or even forward guidance suggesting easing is coming—would be a significant tailwind for Bitcoin. Conversely, if the Fed signals that rates will remain elevated through year-end, BTC could struggle to reclaim highs.
U.S. Treasury Yields
The 10-year Treasury yield spiked above 4.8% in February 2026, its highest level in over a year. Higher yields increase the opportunity cost of holding non-yielding assets like Bitcoin and gold. The correlation between BTC and the inverse of real yields has strengthened in 2026, making bond market dynamics an essential input for any BTC forecast.
U.S. Dollar and Global Liquidity
The U.S. Dollar Index (DXY) strengthened during the February sell-off, adding pressure to Bitcoin and other risk assets denominated in USD. However, global M2 money supply has resumed its expansion as central banks in Europe and Asia maintain accommodative policies. Historically, Bitcoin has shown a strong positive correlation with global liquidity growth with a lag of roughly 3–6 months. If global M2 continues to expand, it could provide a supportive backdrop for BTC in Q3 and Q4 2026.
Derivatives Market: What Traders Are Positioning For
The Bitcoin derivatives market provides valuable insight into trader sentiment and positioning. Several metrics stand out:
- Funding Rates: Perpetual swap funding rates have turned slightly negative on major exchanges like Binance and Bybit, indicating that short positions are paying longs. This typically occurs during periods of bearish sentiment and can be a contrarian bullish signal when sustained.
- Options Skew: The 25-delta put-call skew on Deribit has shifted toward puts, meaning options traders are paying a premium for downside protection. This reflects demand for hedging rather than outright bearish speculation—a sign that holders are protecting positions rather than closing them.
- Open Interest: Aggregate futures open interest fell sharply during the liquidation cascade in February but has been gradually rebuilding. The current OI build-up is more measured and less leverage-heavy than the pre-crash levels, which is healthier from a market structure perspective.
- Liquidation Map: On-chain liquidation data shows significant clusters of long liquidations below $70,000 and short liquidations above $82,000. These levels represent magnetic zones where price may gravitate as market makers hunt liquidity.
Expert Opinions on Bitcoin Price Prediction 2026
Industry experts and analysts hold a range of views on where BTC is headed for the rest of 2026. The table below summarizes notable forecasts:
| Source / Analyst | Price Target (Year-End 2026) | Outlook |
|---|---|---|
| Standard Chartered (Geoff Kendrick) | $120,000 | Bullish — cites ETF demand and post-halving supply dynamics |
| ARK Invest (Cathie Wood) | $100,000–$150,000 | Bullish — institutional adoption thesis remains intact |
| JPMorgan Crypto Research | $72,000 | Neutral-to-Bearish — macro headwinds could limit upside |
| PlanB (Stock-to-Flow Model) | $100,000+ | Bullish — S2F model targets above $100K for post-halving era |
| 10x Research (Markus Thielen) | $85,000 | Cautiously Bullish — sees rangebound action with upside bias |
| Peter Schiff | $40,000 | Bearish — maintains long-standing skeptical stance on BTC |
| Glassnode Research | $90,000–$110,000 | Bullish — on-chain metrics suggest mid-cycle, not top |
It is important to emphasize that expert predictions frequently miss the mark. These forecasts should be used as reference points for understanding the range of possible outcomes, not as investment advice.
Bull Case Scenario: BTC Reclaims $90K and Beyond
Year-end target: $95,000–$120,000
The bullish case rests on several converging factors:
- Fed pivot: If inflation data softens enough for the Fed to cut rates by mid-year, risk assets—including Bitcoin—would likely rally sharply. Historical precedent shows that BTC has outperformed during easing cycles.
- Post-halving supply squeeze: The April 2024 halving reduced Bitcoin’s daily issuance from ~900 BTC to ~450 BTC. The full impact of this supply reduction typically takes 12–18 months to materialize in price. By mid-2026, the halving effect should be in full force.
- ETF demand acceleration: If institutional allocations to Bitcoin ETFs grow from the current ~1% average to even 2–3% of portfolio allocations, the incremental demand would be measured in tens of billions of dollars.
- Global liquidity expansion: Continued M2 growth from major central banks would provide a liquidity tailwind that historically correlates with Bitcoin price appreciation.
- Regulatory clarity: Ongoing progress on crypto regulation in the U.S. and Europe could reduce uncertainty and unlock capital from sidelined institutional investors.
In the bull scenario, BTC would break above the $80,000 resistance zone in Q2, retest the $90,000 all-time high area in Q3, and potentially establish new all-time highs above $100,000 by Q4 2026.
Bear Case Scenario: Deeper Correction or Extended Range
Year-end target: $50,000–$65,000
The bearish case should not be dismissed. Several risk factors could drag BTC lower:
- Persistent inflation and higher-for-longer rates: If the Fed is forced to maintain or even raise rates due to sticky inflation, the liquidity environment would remain hostile for risk assets. Bitcoin has not historically performed well during sustained tightening cycles.
- Recession fears: A U.S. economic slowdown would likely trigger a broader risk-off move. While Bitcoin is sometimes called “digital gold,” it has traded as a risk-on asset during every macro downturn since 2018.
- ETF outflows: If institutional investors decide to reduce crypto exposure—perhaps triggered by a broader equity market correction—sustained ETF redemptions could create significant selling pressure.
- Regulatory crackdown: Although the regulatory trend has been toward accommodation, a sudden shift—such as new restrictions on stablecoins, DeFi, or crypto lending—could dampen sentiment and capital inflows.
- Black swan events: Exchange failures, major smart contract exploits, or geopolitical shocks could trigger sudden sell-offs that break through key support levels.
In the bear scenario, BTC would fail to hold the $72,000 support zone, retest the $60,000 low, and potentially break down toward the $50,000–$55,000 range—a level that coincides with the realized price for all BTC holders and would represent a full retracement of the 2025 rally gains.
Base Case Scenario: Consolidation and Gradual Recovery
Year-end target: $80,000–$95,000
The most probable scenario may be a middle path. In the base case, Bitcoin spends Q2 2026 consolidating in the $70,000–$82,000 range as the market digests the crash and waits for macro clarity. A gradual recovery through Q3 brings BTC back toward $85,000–$90,000 as Fed policy softens, ETF inflows resume in earnest, and the post-halving supply dynamics tighten the market.
This scenario aligns with the historical pattern of post-halving cycles, where Bitcoin typically experiences a sharp correction 6–9 months after the halving event, followed by a sustained rally that extends into the second year post-halving.
Frequently Asked Questions
What is a realistic Bitcoin price prediction for 2026?
Based on current technical, on-chain, and macroeconomic analysis, a realistic range for Bitcoin by the end of 2026 is $80,000–$95,000 in a base case scenario. The bull case extends to $120,000 if macro conditions turn favorable, while the bear case could see BTC at $50,000–$65,000 if monetary tightening persists.
Why did Bitcoin crash in early 2026?
Bitcoin’s crash from ~$90K to ~$60K was primarily driven by a hawkish Federal Reserve surprise in January 2026, rising U.S. Treasury yields above 4.8%, and cascading liquidations across leveraged derivatives positions. The correction was amplified by profit-taking after a strong 2025 rally.
Is Bitcoin a good investment in 2026?
Bitcoin remains a high-risk, high-reward asset. On-chain metrics suggest the current price range may offer value relative to Bitcoin’s historical cost basis, and the post-halving supply dynamics remain supportive. However, macroeconomic uncertainty creates significant near-term risk. Investors should consider their risk tolerance, time horizon, and portfolio diversification before allocating to BTC.
Will Bitcoin reach $100,000 in 2026?
Bitcoin reaching $100,000 in 2026 is possible but would likely require a dovish Fed pivot, sustained ETF inflows, and favorable regulatory developments. Several prominent analysts, including those at Standard Chartered and ARK Invest, have targets at or above this level. However, it is far from guaranteed, and investors should plan for a range of outcomes.
How does the Bitcoin halving affect the 2026 price?
The April 2024 Bitcoin halving reduced block rewards from 6.25 BTC to 3.125 BTC, cutting daily new supply by half. Historically, the halving’s price impact becomes most pronounced 12–24 months after the event, which places the sweet spot in mid-to-late 2026. Reduced supply, combined with growing demand from ETFs and institutional buyers, creates a supply-demand imbalance that has historically driven significant price appreciation.
The Bottom Line
Bitcoin’s early 2026 crash was a painful but not unprecedented event in the context of crypto market cycles. The recovery from $60K to $75K shows that buyers remain willing to step in at lower levels, and on-chain data confirms that long-term holders have not lost conviction. However, the path back to $90,000 and beyond is far from straightforward.
The macro environment—particularly the Federal Reserve’s interest rate decisions and the trajectory of U.S. Treasury yields—will be the single most important determinant of Bitcoin’s 2026 performance. Traders should watch the $72K support and $80K resistance levels as near-term directional signals, while keeping an eye on ETF flow data and on-chain accumulation trends for confirmation of the broader trend.
Whether you are bullish, bearish, or somewhere in between, risk management remains paramount. Position sizing, diversification, and a clear understanding of your personal risk tolerance are more important than any price prediction.
Written by BTCover Editorial Team
内容搜集自网络,整理者:BTCover,如若侵权请联系站长,会尽快删除。